Decoding the Bitcoin Price Graph A Comprehensive Guide
Unravel the mysteries of the Bitcoin price graph! See trends, predict moves, and understand the crypto market like a pro. Get your Bitcoin insights now!
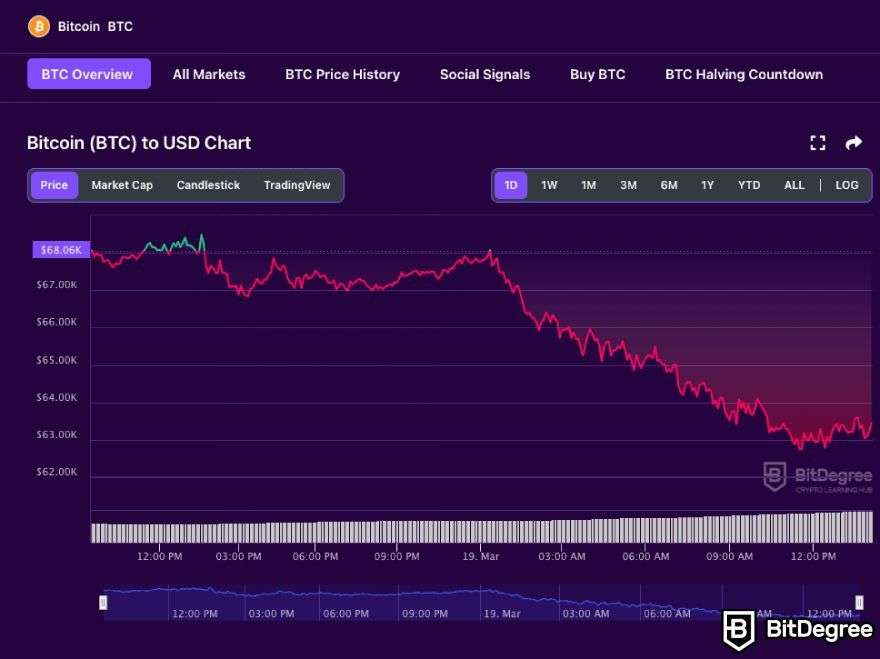
The bitcoin price graph is a dynamic visual representation of the value of Bitcoin over time, reflecting the complex interplay of market forces, investor sentiment, and global events. Interpreting this graph requires a nuanced understanding of its various components and the factors that contribute to its fluctuations. Rather than simply observing the price at a given moment, a comprehensive analysis involves examining trends, patterns, and historical data to discern potential future movements. Therefore, a thorough understanding of the bitcoin price graph is essential for anyone looking to participate in the cryptocurrency market.
Decoding the Bitcoin Price Graph: Key Components
The Bitcoin price graph isn’t just a line moving up and down. It’s packed with information that experienced traders and investors use to make informed decisions. Let’s break down the key components:
- X-axis (Horizontal): Represents time. This can be displayed in various intervals, from minutes to years, depending on the desired level of granularity.
- Y-axis (Vertical): Represents the price of Bitcoin, typically in US dollars (USD) or another fiat currency.
- Candlesticks/Lines: Show the price movement within a specific timeframe. Candlesticks, in particular, provide a wealth of information, including the opening price, closing price, high price, and low price for that period.
- Volume Indicators: Display the trading volume for each period, indicating the level of market activity.
- Moving Averages: Smooth out the price data to identify trends and potential support/resistance levels.
Candlestick Patterns Explained
Candlestick charts are a powerful tool for analyzing price movements. Each candlestick represents a specific time period and provides four key data points:
- Open: The price at which trading began.
- High: The highest price reached during the period.
- Low: The lowest price reached during the period.
- Close: The price at which trading ended.
The body of the candlestick represents the difference between the opening and closing prices. A green (or white) candlestick indicates that the closing price was higher than the opening price, signifying a bullish (positive) trend. A red (or black) candlestick indicates that the closing price was lower than the opening price, signifying a bearish (negative) trend. The “wicks” or “shadows” extending above and below the body represent the high and low prices reached during the period.
Factors Influencing Bitcoin Price Fluctuations
Numerous factors can impact the price of Bitcoin, making it a volatile asset. Understanding these factors is crucial for interpreting the bitcoin price graph and making informed investment decisions.
- Supply and Demand: Basic economic principles apply. Increased demand with limited supply drives up the price, while increased supply with limited demand drives it down.
- Market Sentiment: News, social media, and general investor confidence can significantly influence Bitcoin’s price.
- Regulatory Developments: Government regulations and legal frameworks related to cryptocurrency can have a major impact.
- Technological Advancements: Developments in blockchain technology and the Bitcoin network itself can affect its perceived value.
- Macroeconomic Events: Global economic conditions, such as inflation, interest rates, and geopolitical events, can influence investor behavior and impact the price of Bitcoin.
Analyzing the Bitcoin Price Graph for Investment Decisions
While past performance is not indicative of future results, analyzing historical data on the bitcoin price graph can provide valuable insights for investment decisions. Traders often use technical analysis techniques, such as identifying support and resistance levels, trendlines, and chart patterns, to predict potential price movements.
Ultimately, the interpretation of the bitcoin price graph is a skill honed through practice and experience. Mastering this analysis is crucial, and the first sentence of the final paragraph highlights the importance of understanding this for anyone actively involved in the crypto space.
Remember that risk management is paramount. Never invest more than you can afford to lose, and always diversify your portfolio. The bitcoin price graph is a tool, not a crystal ball, and should be used in conjunction with other research and analysis.
BEYOND THE BASICS: ADVANCED ANALYSIS TECHNIQUES
For seasoned traders and investors, basic chart reading is just the starting point. Advanced analysis techniques can provide even deeper insights into potential price movements.
– Fibonacci Retracements: These are horizontal lines on a chart that indicate potential support and resistance levels based on Fibonacci ratios.
– Elliott Wave Theory: This theory suggests that prices move in specific patterns called “waves” and can be used to predict future price movements.
– Ichimoku Cloud: This is a complex indicator that provides information about support and resistance, trend direction, and momentum.
– Relative Strength Index (RSI): This momentum indicator measures the magnitude of recent price changes to evaluate overbought or oversold conditions in the price of an asset.
CHOOSING THE RIGHT PLATFORM FOR BITCOIN PRICE GRAPH ANALYSIS
Numerous platforms offer Bitcoin price graphs and analytical tools. When choosing a platform, consider the following factors:
– Data Accuracy: Ensure the platform provides accurate and reliable price data.
– Charting Tools: Look for a platform with a wide range of charting tools and indicators.
– User Interface: Choose a platform with a user-friendly and intuitive interface.
– Real-Time Data: Access to real-time price data is essential for day trading and short-term investing.
– Mobile Accessibility: A mobile app can allow you to monitor the Bitcoin price graph on the go.
In conclusion, the bitcoin price graph offers a wealth of information for understanding market trends and making informed investment decisions, however, it’s essential to approach it with a critical eye, combine it with other research, and always prioritize risk management.